

Expanding to Become the World’s Largest AI Tools Directory
Written by Jesse Weltevreden
This summer RankmyAI expanded its database to over 46,000 AI tools and companies, becoming the largest AI tool directory in the world. The update brings major improvements in data completeness, shifts in use cases and country representation, and more detail on founding years and company sizes.
We have been working hard this summer to expand the RankmyAI database. At the time of writing our platform lists 25,027 AI tools and companies. This number changes daily as we add newly launched tools and remove inactive ones.
The latest update is one of our most significant so far. We have added 21,575 new AI tools and companies, nearly doubling the size of our dataset. With more than 46,000 AI tools now catalogued, RankmyAI has the largest AI tool database in the world.
We focus only on tools and companies where AI is a core component of the product or service, and we include only those with a dedicated website or subdomain. This allows us to rank them on factors such as web traffic, investment data, and user reviews. Our database does not include GPTs, mobile apps, or browser extensions unless they have their own website. For more details, see our methodology section.
The new dataset is different from the old one in several important ways, which we explain below.
1. Improved Data Completeness
One of the clearest differences between the old and new datasets is the amount of background information we have for each AI tool and company.
In the new dataset, the location of the tool or company is missing for only 15% of entries, compared to 37% in the previous dataset. We know the founding year for 75% of tools in the current dataset, compared to 61% before. Company size is missing for only 0.3% of companies in the current dataset, compared to 34% in the previous one.
These improvements mean we can now give more complete profiles for most tools and companies in our database. This also allows for more detailed analysis and better comparisons.
2. Differences in Tool Composition and Use Cases
When comparing the previous and new datasets, the mix of use cases changed a lot. In the previous dataset, creative and marketing-focused categories such as image generation, content generation, image editing, language translation, and video generation were more common. There were also many tools for email marketing, lead generation, and search engine optimisation.
In the new dataset these categories are less common, while areas such as data science solutions, customer service management, supply chain management, data analysis, and risk assessment and management are seen more often. Categories such as predictive analytics, cloud computing, compliance management, and AI agent generation are also more visible, although they were already present in smaller numbers before. Overall the set has more business-oriented and technical applications, with creative use cases playing a smaller role.
These differences are mainly the result of how the data was collected. The old dataset included many generative AI tools, often with little transparency about the companies behind them. The new dataset is based on active .ai domain names, which include a larger share of business-to-business tools, consultancy services, and AI tool development companies.
3. Differences in Country Representation
In the previous dataset the United States accounted for the largest share of tools, followed by the Netherlands, the United Kingdom, Germany, and India. Canada and France were also in the top 10, along with China, Norway, and Chile.
In the new dataset the United States remains in first place, but the rest of the list looks different. The United Kingdom and India now take second and third place, with Canada and Germany following. Australia, Singapore, the United Arab Emirates, and Spain have entered the top 10, while the Netherlands, China, Norway, and Chile have dropped out.
Our old dataset is to a great extent similar to the data in the most widely used AI tools directories, which often have a strong bias towards US-based tools. The new dataset is based on active .ai domain names, which gives a broader geographic spread and brings in more tools from countries such as India and the United Kingdom. The high number of Dutch and Norwegian tools in the first dataset comes from our deep-dive research for the AI Report Netherlands 2025 and the AI Report Norway 2025, which added many tools from those countries that would otherwise not have been found.
While no single source can ever fully capture the fast‑changing AI landscape, we are always expanding, combining our large‑scale data collections with focused deep dives. The deep dives give us a detailed view of a specific country, while the large‑scale collections add substantial numbers of tools to our database. Community contributions have also helped broaden our coverage. We are currently preparing our next country reports, with a focus on current growth markets.
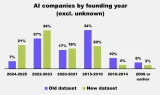
4. Differences in Founding Year
To make a fair comparison, we have excluded companies with an unknown founding year from both datasets.
In the old dataset, the largest share of companies (34%) were founded between 2015 and 2019. This was followed by 27% from 2022–2023 and 17% from 2020–2021. Only 7% were from 2024–2025, while 10% dated from 2010–2014 and 6% from 2009 or earlier.
In the new dataset, the distribution shifts towards younger companies. The 2022–2023 group is now the largest at 34%, followed by 21% in 2024–2025 and 20% in 2015–2019. Companies from before 2010 make up only 3%, and those from 2010–2014 just 4%.
This change reflects the nature of our data sources. The .ai domain–based method used for the current dataset captures many more recently established companies, while the previous dataset included a broader mix of younger and older organisations, partly due to our deep‑dive research in specific countries, which often uncovered long‑established tools.
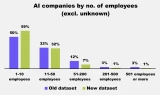
5. Differences in Company Size
For this comparison we excluded all companies for which the number of employees is unknown.
In the old dataset, half of the companies (50%) had between 1 and 10 employees, followed by 33% in the 11–50 employee range. Larger companies were less common, with 12% in the 51–200 range, and only 3% each in the 201–500 and 501+ categories.
In the new dataset, the share of very small companies is even higher, with 59% having 1–10 employees. The proportion of companies with 11–50 employees is similar to before at 32%. The representation of larger organisations is lower: 7% have 51–200 employees, and just 1% each fall into the 201–500 and 501+ employee categories.
This shift towards smaller company sizes reflects the impact of our .ai domain–based data collection, which captures many small and early‑stage companies. The old dataset, by contrast, included a broader mix of sizes, partly due to tools identified in our country deep dives, which often surfaced more established and larger companies.
Conclusion
At RankmyAI our goal is to map the rapidly changing landscape of AI tools. This includes not only generative AI but also more established areas such as computer vision, machine learning, natural language processing, and predictive modelling. This latest dataset is a valuable addition, especially for capturing business-to-business tools and providers of consultancy and AI tool development services.
We now host the largest AI tool database in the world. While no single source can capture every AI tool in existence, our targeted deep dives and the valuable input we receive from our community regularly uncover many more tools per country than standard listings. This combination of scale, accuracy, and collaboration makes RankmyAI the ideal partner for mapping national, regional, and sector-specific AI ecosystems. We will continue expanding our database to keep it the most comprehensive and useful resource available.
For national and local governments, research institutions, AI hubs, trade associations, consultancy companies, and venture capitalists, RankmyAI can produce tailored industry, country, and regional analyses and rankings. If you are interested in such insights, please contact us.


